I played a bit with Steaphany files. Graph below is purely technical (like my notes), but maybe it does help to someone, wanting better understand Foveon sensor characteristics. At least usable EV range can be seen on that graph easily.
I analyzed pure RAW data before conversion it to real RGB values; that means that RGB values on graph are sensor readings and they do not exactly correspond to visible colors.
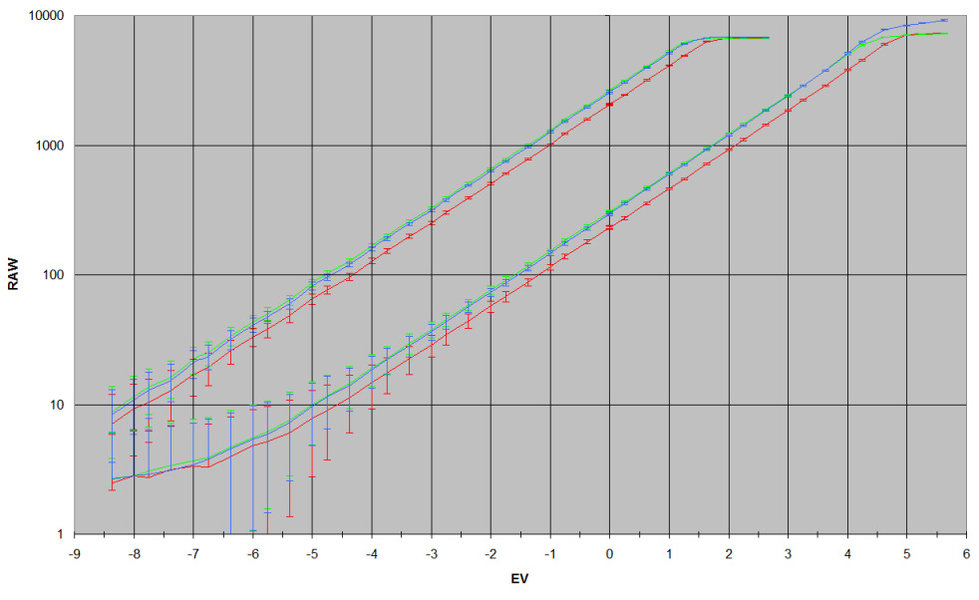
On graph there are two families of response curves - for colorchechker card white (upper curves) and darkest gray (lower curves) patch. EV values are relative to some 'normal' exposure; I think this 'normal' is actually a bit underexposed, but this doesn't change sensor behavior.
I added error bars, displaying standard deviation of measured values; they may be used as 'noise' indicator. (Note that 'noise' wouldn't be computable if I would use entire image for data source.) Using symmetrical deviation is actually not correct, for lower values error margins went below zero, what is impossible - thereby take that 'noise' as only very rough approximation of real noise. I din't analyze 'noise' characteristics.
Because human eye sensibility is logarithmic, then RAW values are presented on logarithmic scale. EV values are internally logarithmic too - one stop means 'two times'.
I think such logarithmic behavior of RAW values was not taken into consideration in previous graphs, thereby they are not so linear
")
RAW internal values usually max out about at 6600, although for gray patch blue channel got as high of 9000. Most probably sensor data is altered before writing into RAW file; I've somewhere read about linearization and dark frame is subtracted too. A/D converter in camera rumoured to be 12bit one; looking at graps there can be 12bit (=12EV) of dynamic range (from -8 to +4EV), but noise makes lower part of it unusable. 10 stops seems achievable; depends on noise characteristic.
View attachment 1850
If someone is interested in actual numerical values (and excel table), please email me or ask here.