DPR Forum

Welcome to the Friendly Aisles!
DPRF is a spin-off of dpreview. We are a photography forum with people from all over the world freely sharing their knowledge and love of photography. Everybody is welcome, from beginners to the experienced professional. From smartphone to Medium Format.

DPRF is a community for everybody, every brand and every sensor format. Digital and film.
Enjoy this modern, easy to use software. Look also at our Reviews & Gallery!

!!! SIGMA SD1 - 46Mpx !!!

I got 3 from B&H and all the 3 ones were crap. The fourth one is better but still not good. I have 3 Sigma lenses, the 3 macros 70/105 and 150 and i said that they are great lenses.

What's your problem ? Anedoctal ? Do you even know me to said this ? Are you telling me that I'm a liar and just repeating what some schmuck said ? Are you serious ?

Hi,

The word "anecdotal" is not a derogatory word. I meant no disrespect in its use. I merely meant that it was one example of a person havin a problem with a product. Not necessarily everybody or large numbers of folks having that problem. no implication that you were not being personally truthful, just trying to say that we have not all had that problem. Please continue to enjoy this thread and be vocal etc. Regards.
 
Sure , here is the Leica=R 19mm f2.8 Elmarit:


And this is what Erwin Putts from leica has to say about it:

At full aperture the Elmarit-R 19mm f/2.8 has a high contrast
image with crisp definition of very fine detail over a
large part of the image area. The extreme corners are a bit
soft, but when using slides this edge area will be covered
by the slide mounts. The sagittal and tangential lines are
very close, indicating absence of coma and astigmatism.
Very fine detail is being represented by the 20 Lp/mm line
and we can see that even at 2.8 the contrast of 60% is held
till an image height of 15mm, giving an image circle of
30mm diameter

View attachment 2391

View attachment 2392

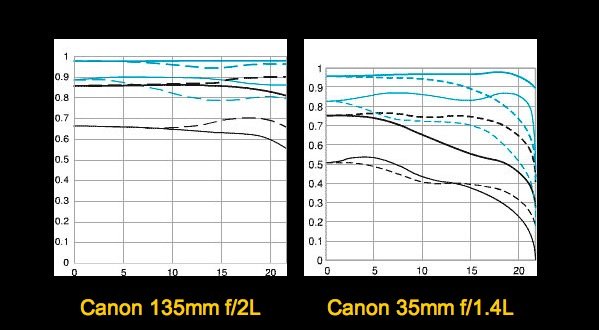
If you dont like what Leica says and prefer Japanese lenses here are some Canon lenses by Luminous Landscape:
View attachment 2393

Luis
SIGMA CUM LAUDE
Please click here to visit our new Forum
--
http://photo.net/photos/Luis-A-Guevara
http://www.pbase.com/luis_a_guevara/galleries
http://gallery.leica-users.org/v/LUIS+A+GUEVARA/
http://www.summiluxart.com/
http://www.sigmacumlaude.com/

Hi Luis,

You and I have different notions of just what an MTF curve is. To me, it's a plot Contrast as a function of spatial frequency. Typically, provided the lens is symetric etc, such a thing migh resemble a Gaussian function with a certain full width at half max. That point at which the contrast is ruded to half, might be broadly considered the lens resolution. The curves you've shown here, are exactly like what I tried to describe earlier as being the way DSLR mfgrs describe their lens performance. It may be possible deduce an MTF from such plots, provided one has a plausible idea of the MTF functional form; and provided, say, one could fit that function with two parameters.
In any case, the general graphs you have shown here bear out my point that when you view, for example, the Leica data it shows a series of plots of sharpness as a function radial displacement from the lens axis. In the case of the APS-C sized sensor, one only has to worry about performance out to 12mm. All those data points beyond that would miss the sensor entirely. All lenses show this sort of general behavior and the question is will it be good enough out to the smaller sensor edge. If you are designing a lens for MF, you have a lot extra work and expense to get good performance out to these larger distances. That's all I am saying.
Note also that that wide open data at 30 lp/mm, which represents sharpness, does not directly say that the lens is capable of 100 lp/mm. One might say, qualitatively that it's sharper than a certain other lens. Will it resolve 100lp/mm? Show me the MTF.

You are right . You seem to be confusing a Point Spread Graph plot for an MTF plot.

This is a P.S.F.

View attachment 2398

The PS is very conected to the MTF , and according to Zeiss :


"A diffraction-limited image has an almost
perfectly straight MTF curve which
decreases in proportion to the spatial
frequency.

The zero MTF value is reached
at the so-called limit frequency, which is
determined by the f-number and the
wavelength of the light.

A rough estimate for medium
wavelengths of visible light is:
The width of the point spread in μm
corresponds to the f-number, and the
limit frequency is about 1500 divided
by the f-number."


MTF plots, as you correctly pointed out , before you introduced this confusing notion :

....such a thing migh resemble a Gaussian function with a certain full width at half max. That point at which the contrast is ruded to half, might be broadly considered the lens resolution.....

are created to show the effect of Spatial Frequency on Contrast and are commonly used to COMPARE the performance of lenses against each other, where you can clearly see see that lens B is better than A and better than C which is the first to reach the 50 percent of its maximum contrast .
These previous kind of Graph are useful for COMPARISONS ,such as when Manufacturing determines if the lens "PASSES" when compared with a SAMPLE LENS OF MINIMUM ACCEPTED PERFORMANCE .


View attachment 2395

Sometimes a Spatial Frequency response plot is used to determine the theoretical point of contrast extinction or absolute MAXIMUM THEORETICAL RESOLUTION, when contrast reaches ZERO.T


View attachment 2397


However when it comes to LENS PERFORMANCE ANALYSIS ,during design , you have to study the lens AGAINST ITSELF at different apertures (and sometimes at different wavelengths of light), at all position of the lens surface starting from the Center of the lens (Sagital).


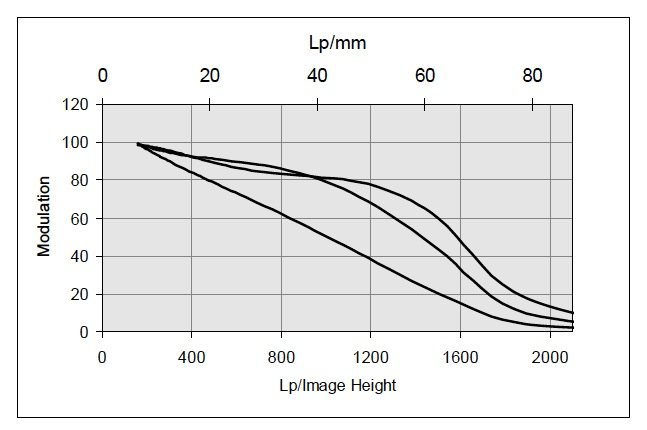
That is better done by plotting the MTF found at each corresponding Spatial Frequencies ( And only at the most meaningful to the designer), versus the position in the lens surface , where they where measured at, starting from the center all the way to the edges of the glass .In practice , as you can see in this plot , it is usually more useful to Plot Modulation against LINE PAIRS PER IMAGE HEIGHT, as shown in previous posts:

View attachment 2208


Modern MTF plots looks like this , and are more useful for examining a lens ACTUAL ability to form an image and that is why is what you most commonly find published :


View attachment 2207

I think that these excursions into Optics are a lateral distraction from the points that were being made in the Forum and I will not engage in them anymore out of respect of forum etiquette .

Common sense indicates that we get what we pay for. Most people buy Sigma products because they are the cheapest in the Market . Some people , including myself , buys them only for the Foveon sensor and its intrinsic qualities. However the more that the Sensor has moved away from its original American conception , the more its image quality is reassembling Bayer sensors.

The SD1 camera is still a very primitive , spartan camera and although it has grown in quantitative terms ( More Megapixels and Higher price) it has lost in Qualitative terms ( Less Sharp , Lens limited ).

My personal opinion is that some other Manufacturer will pick up were Sigma has reached its limit of incompetence and we will soon see real good implementations of the layered sensor architecture at reasonable prices.

In the mean time we can try to get the most of the SD1 by changing the brand of lens we use.


Luis
SIGMA CUM LAUDE
Please click here to visit our new Forum
--
http://photo.net/photos/Luis-A-Guevara
http://www.pbase.com/luis_a_guevara/galleries
http://gallery.leica-users.org/v/LUIS+A+GUEVARA/
http://www.summiluxart.com/
http://www.sigmacumlaude.com/
 

Attachments

  • Screen shot 2011-07-05 at 9.49.40 AM.jpg
    EXIF
    Screen shot 2011-07-05 at 9.49.40 AM.jpg
    46.1 KB · Views: 4
  • Screen shot 2011-07-04 at 2.29.07 PM.jpg
    EXIF
    Screen shot 2011-07-04 at 2.29.07 PM.jpg
    53.5 KB · Views: 5
Sure , here is the Leica=R 19mm f2.8 Elmarit:


And this is what Erwin Putts from leica has to say about it:

At full aperture the Elmarit-R 19mm f/2.8 has a high contrast
image with crisp definition of very fine detail over a
large part of the image area. The extreme corners are a bit
soft, but when using slides this edge area will be covered
by the slide mounts. The sagittal and tangential lines are
very close, indicating absence of coma and astigmatism.
Very fine detail is being represented by the 20 Lp/mm line
and we can see that even at 2.8 the contrast of 60% is held
till an image height of 15mm, giving an image circle of
30mm diameter

View attachment 2391

View attachment 2392

If you dont like what Leica says and prefer Japanese lenses here are some Canon lenses by Luminous Landscape:
View attachment 2393

Luis
SIGMA CUM LAUDE
Please click here to visit our new Forum
--
http://photo.net/photos/Luis-A-Guevara
http://www.pbase.com/luis_a_guevara/galleries
http://gallery.leica-users.org/v/LUIS+A+GUEVARA/
http://www.summiluxart.com/
http://www.sigmacumlaude.com/

You are right . You seem to be confusing a Point Spread Graph plot for an MTF plot.

This is a P.S.F.

View attachment 2398

The PS is very conected to the MTF , and according to Zeiss :

"A diffraction-limited image has an almost
perfectly straight MTF curve which
decreases in proportion to the spatial
frequency.

The zero MTF value is reached
at the so-called limit frequency, which is
determined by the f-number and the
wavelength of the light.

A rough estimate for medium
wavelengths of visible light is:
The width of the point spread in μm
corresponds to the f-number, and the
limit frequency is about 1500 divided
by the f-number."

MTF plots, as you correctly pointed out , before you introduced this confusing notion :

....such a thing migh resemble a Gaussian function with a certain full width at half max. That point at which the contrast is ruded to half, might be broadly considered the lens resolution.....

are created to show the effect of Spatial Frequency on Contrast and are commonly used to COMPARE the performance of lenses against each other, where you can clearly see see that lens B is better than A and better than C which is the first to reach the 50 percent of its maximum contrast .
These previous kind of Graph are useful for COMPARISONS ,such as when Manufacturing determines if the lens "PASSES" when compared with a SAMPLE LENS OF MINIMUM ACCEPTED PERFORMANCE .

View attachment 2395

Sometimes a Spatial Frequency response plot is used to determine the theoretical point of contrast extinction or absolute MAXIMUM THEORETICAL RESOLUTION, when contrast reaches ZERO.T


View attachment 2397


However when it comes to LENS PERFORMANCE ANALYSIS ,during design , you have to study the lens AGAINST ITSELF at different apertures (and sometimes at different wavelengths of light), at all position of the lens surface starting from the Center of the lens (Sagital).


That is better done by plotting the MTF found at each corresponding Spatial Frequencies ( And only at the most meaningful to the designer), versus the position in the lens surface , where they where measured at, starting from the center all the way to the edges of the glass .In practice , as you can see in this plot , it is usually more useful to Plot Modulation against LINE PAIRS PER IMAGE HEIGHT, as shown in previous posts:

View attachment 2400


Modern MTF plots looks like this , and are more useful for examining a lens ACTUAL ability to form an image and that is why is what you most commonly find published :


View attachment 2399

I think that these excursions into Optics are a lateral distraction from the points that were being made in the Forum and I will not engage in them anymore out of respect of forum etiquette .

Common sense indicates that we get what we pay for. Most people buy Sigma products because they are the cheapest in the Market . Some people , including myself , buys them only for the Foveon sensor and its intrinsic qualities. However the more that the Sensor has moved away from its original American conception , the more its image quality is reassembling Bayer sensors.

The SD1 camera is still a very primitive , spartan camera and although it has grown in quantitative terms ( More Megapixels and Higher price) it has lost in Qualitative terms ( Less Sharp , Lens limited ).

My personal opinion is that some other Manufacturer will pick up were Sigma has reached its limit of incompetence and we will soon see real good implementations of the layered sensor architecture at reasonable prices.

In the mean time we can try to get the most of the SD1 by changing the brand of lens we use.

Luis
SIGMA CUM LAUDE
Please click here to visit our new Forum
--
http://photo.net/photos/Luis-A-Guevara
http://www.pbase.com/luis_a_guevara/galleries
http://gallery.leica-users.org/v/LUIS+A+GUEVARA/
http://www.summiluxart.com/
http://www.sigmacumlaude.com/

That last plot where you show Modulation versus spatial frequency was what I was looking for. That's the only MTF you've shown so far. And it's for a nameless lens. Can you show that same curve for the Leica you mentioned earlier. As to the discussion of Optics, what else is this about? It's particularly important when folks are making disparaging comments about the integrity of firms. The performance of these lenses/cameras depend on Physics alone. Not on Brand predelections and mumbo jumbo.
 
Back
Top